

SMS Campaign Metrics: Track Delivery, CTR & ROI

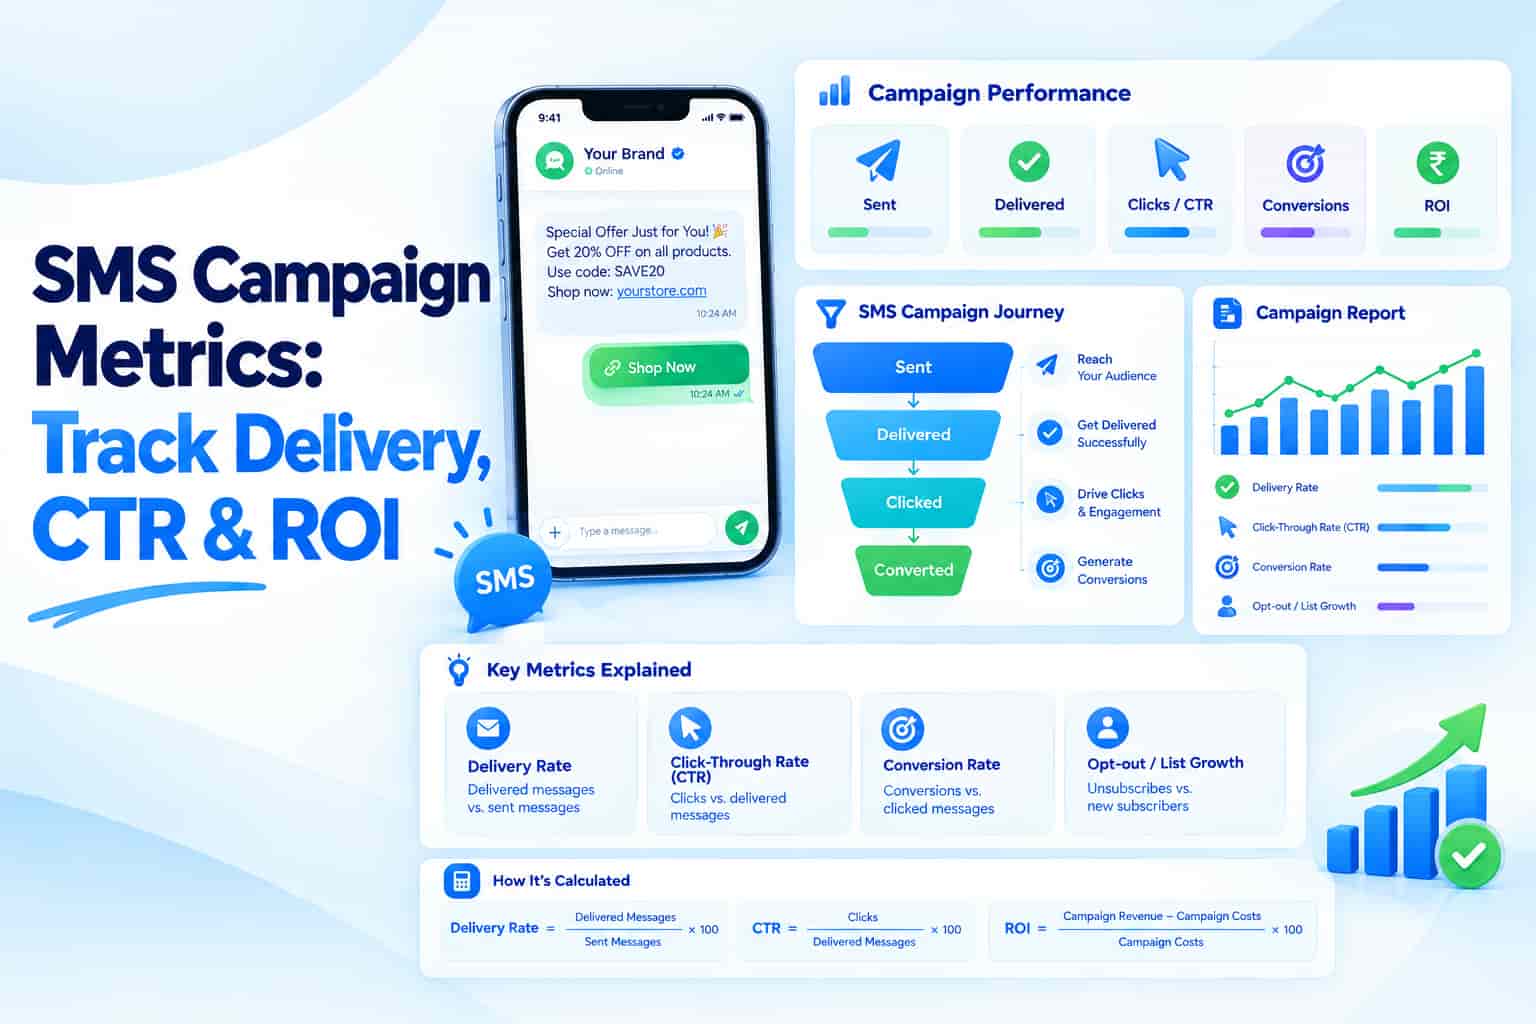
Sending a bulk SMS campaign is the easy part. Knowing whether it actually worked is where many businesses get stuck. Without the right numbers you cannot tell whether a campaign made money, which message wins or whether your list is healthy. This guide explains the SMS marketing metrics that matter, how to calculate them, how to track conversions without complicated tools and how to improve results from one campaign to the next.
Why Tracking Matters
SMS is direct and fast, but a single campaign can cost thousands of rupees. Tracking tells you what to repeat, what to fix and where to invest next. It also protects your sender reputation, because rising failure or opt-out rates are early warning signs that something is wrong with your list, template or timing. For an overview of why the channel deserves this attention, see our guide to the benefits of SMS marketing.
Delivery Metrics
Start with delivery rate, which is the number of delivered messages divided by the number sent, multiplied by 100. A low rate usually points to invalid numbers, DND issues, template mismatches or problems with the route. Next, look at delivery time, which matters enormously for OTPs and time-sensitive alerts, where a delay of a minute can ruin the experience. Finally, read the failure reasons in your delivery report, because they explain exactly why messages did not arrive, such as an invalid number, a switched-off handset or a template that did not match.
Engagement Metrics
Once messages arrive, you want to know whether people respond. Click-through rate is the number of clicks on your short link divided by delivered messages, and it shows how appealing your message and offer are. Reply rate matters for two-way SMS, keyword campaigns and surveys, while call-backs and missed calls are especially important for local businesses such as clinics, dealers and real estate agents, where the phone is still the main conversion point.
Business Metrics
Engagement is useful, but money is the real test. Conversion rate is the number of purchases, bookings or sign-ups divided by delivered messages. Revenue per message divides total campaign revenue by messages sent, and cost per conversion divides total cost by the number of conversions. Return on investment is revenue minus cost, divided by cost. Consider a campaign of 10,000 messages costing Rs 2,000 in total. If 9,500 are delivered, 380 people click and 57 buy, generating Rs 45,000, the delivery rate is 95%, the click-through rate is 4% and the cost per conversion is about Rs 35. Numbers like these let you compare campaigns objectively rather than relying on a gut feeling.
List Health Metrics
A campaign can look successful while quietly damaging your list. Watch the opt-out rate, because a rising figure means you are sending too often or targeting poorly. Keep an eye on the invalid number rate and clean your database regularly. Also monitor complaints, since too many complaints to operators can lead to restrictions on your header or number.
How to Track Conversions
You do not need expensive software to connect messages with sales. Use a unique short link in every campaign so you can count clicks accurately, and add UTM parameters so Google Analytics attributes visits and purchases to the right message. Create coupon codes that are unique to the campaign and can be redeemed online or in the store, and use a dedicated call-back or missed call number to measure offline response. Where possible, match phone numbers against purchase records in your CRM to see exactly who bought after receiving a message.
Test and Compare Systematically
The fastest way to improve is to run simple tests. Split a segment into two equal groups, change one variable such as the offer, the wording, the send time or the call to action, and compare the results. Keep a small control group that receives no message at all, so you can see how many customers would have bought anyway. This reveals the true lift your campaign created, which is often smaller than the raw sales figure suggests.
Turning Numbers into Action
Each metric points to a fix. A low delivery rate means cleaning the list and checking templates and DND settings. A weak click-through rate suggests testing a clearer offer or a stronger call to action. If people click but do not convert, the problem is probably the landing page or checkout. A rising opt-out rate calls for fewer messages and better segmentation. Pairing SMS with other channels helps too, and our guide on when to use SMS over social media can help you choose the right mix.
Frequently Asked Questions
What is a good SMS click-through rate?
It varies by industry, audience and offer, so benchmark against your own past campaigns first.
Can I track SMS results without a website?
Yes. Use coupon codes, call-back numbers, missed calls or in-store redemption tracking.
How often should I review campaign reports?
After every campaign, and then monthly to spot trends in delivery, engagement and opt-outs.
Conclusion
The right SMS campaign metrics turn bulk messaging from guesswork into a measurable growth channel. Track delivery, engagement, conversions and list health, use unique links and codes, test one change at a time and keep a control group. Each campaign then teaches you how to earn more from the next.
OM Enterprises provides bulk SMS services with detailed delivery reports, click tracking and campaign analytics. Talk to us about your next campaign and start measuring what matters.